A Data-Backed Guide to Turning Viewers Into Brand Advocates
Most brands still treat social media like a megaphone, post content, hope for likes, repeat. But the businesses actually winning on social platforms treat it like a funnel: a structured journey that carries a stranger from “never heard of you” all the way to “tells everyone about you.” With 5.79 billion social media identities now active worldwide, representing close to 70% of the global population and growing by roughly 294 million new identities a year, that journey has become one of the most important growth engines a business has.
Let’s breaks down the five-stage social media marketing funnel — Awareness, Engagement, Conversion, Loyalty, and Advocacy — pairs each stage with current data, digs into how AI is reshaping every layer of that funnel, and closes with a practical planning framework you can use to build your own strategy.
The Funnel Shape, Explained
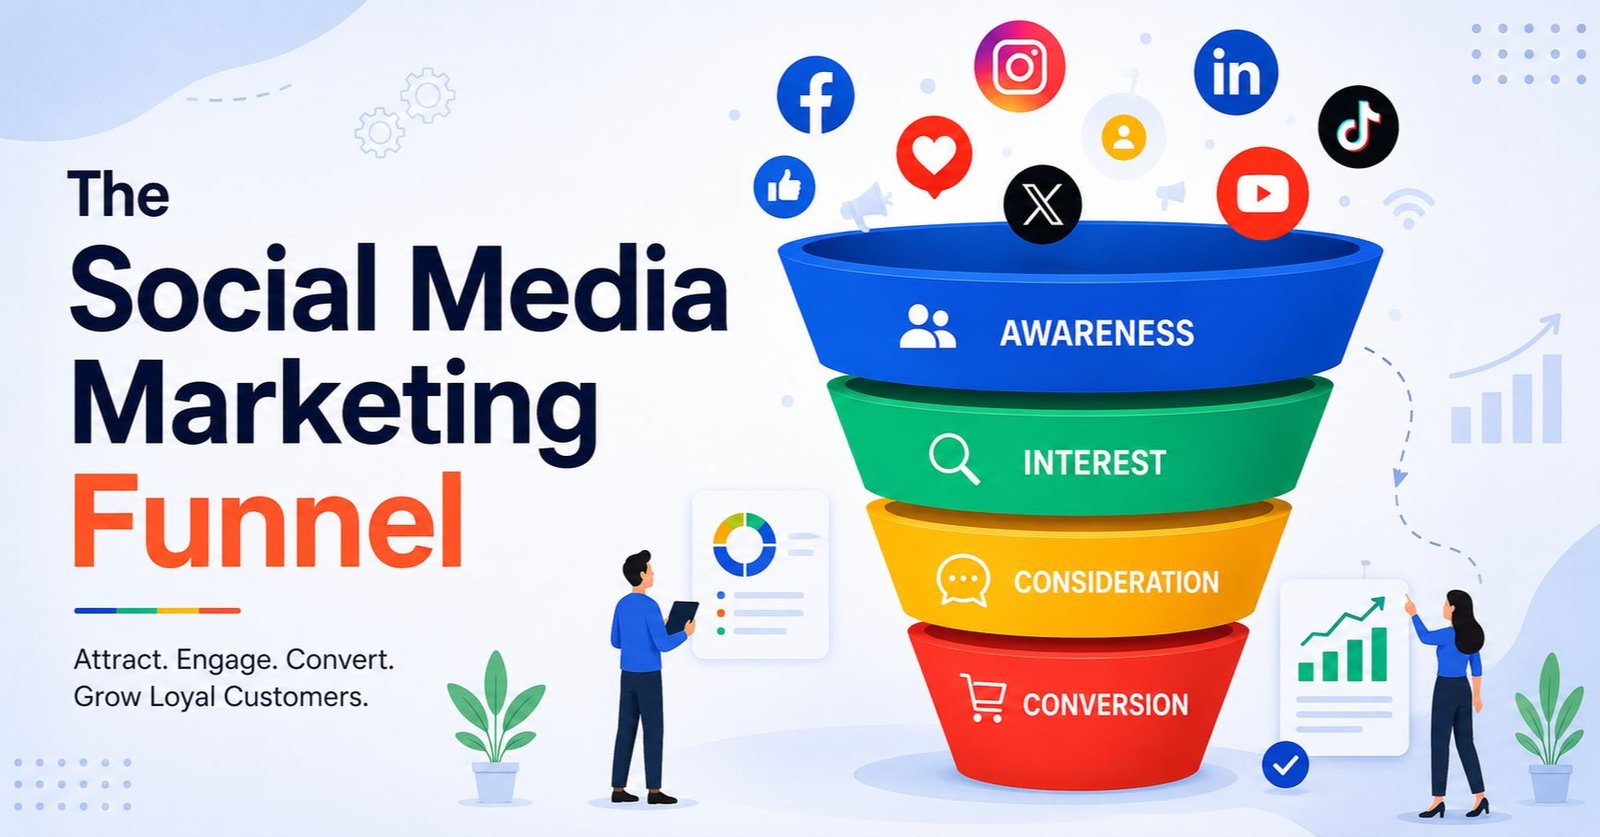
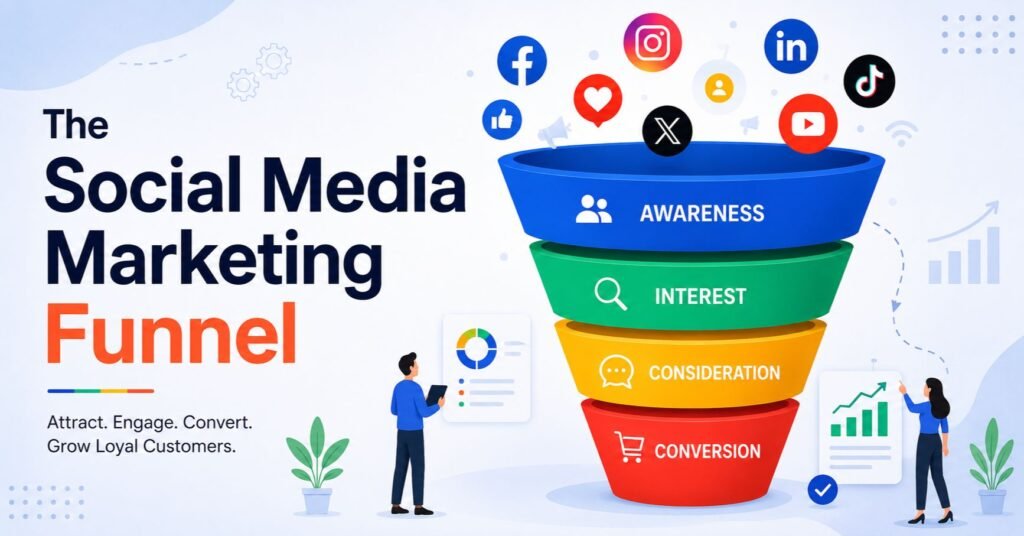
A classic marketing funnel is wide at the top and narrow at the bottom, and that shape isn’t decorative, it’s a reflection of attrition. Most people who see an ad will never buy anything; most people who buy once will never buy again unless something changes their mind. The social media funnel simply names each drop-off point so you can design something specific for it: awareness content to widen the top, engagement content to slow the drop-off in the middle, conversion tactics to force a decision, and loyalty and advocacy work to keep former customers inside the system instead of losing them for good. Each stage below corresponds to specific tactics, a specific audience state, and specific benchmarks worth measuring against.
Why a Funnel, Not a Feed
A funnel forces discipline. Instead of posting randomly, every piece of content is mapped to a specific job: attract a stranger, hold their attention, convert their interest into a lead, keep them as a customer, or turn them into a promoter. Social media has fully matured into this role, it’s no longer just a brand-awareness channel. According to eMarketer’s 2026 forecast, social platforms now function as a full-funnel commerce engine where discovery, consideration, and purchase can all happen inside a single session, and 43% of marketers now rank social media as their highest-ROI channel, ahead of both SEO and email.
That full-funnel reality maps closely onto the five classic stages of the social funnel.
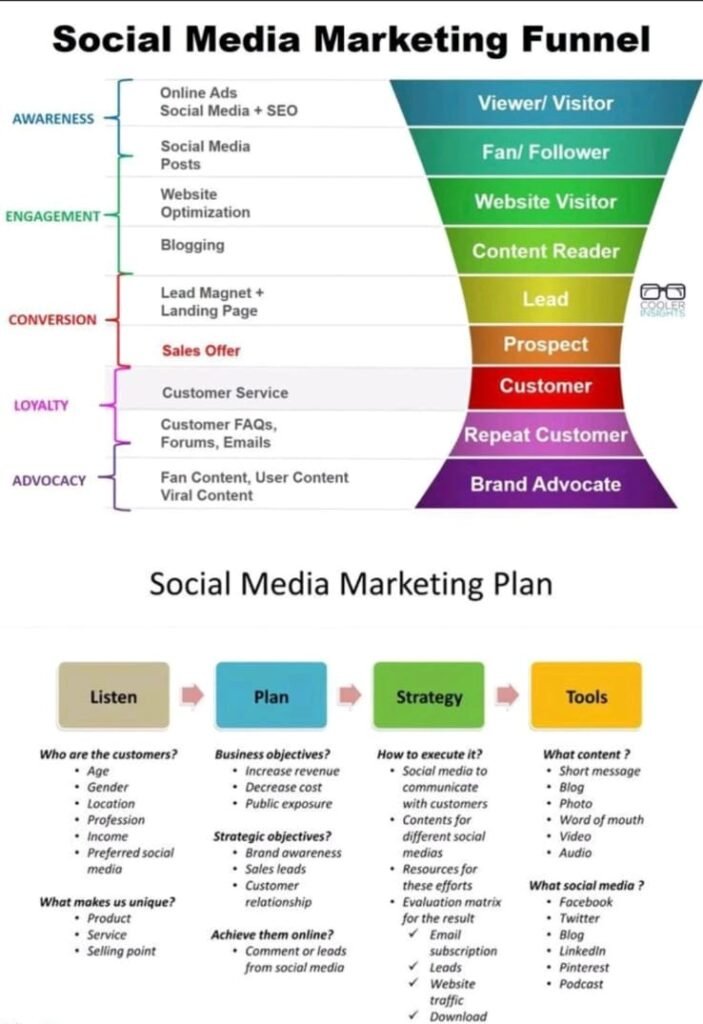
Stage 1: Awareness — Viewer / Visitor
This is the top of the funnel, where the goal is simply to be seen. The tactics here are online ads, social media plus SEO, and paid promotion designed to convert a stranger into a viewer or visitor.
Awareness spending is enormous and growing. Global social media ad spend is projected at roughly $276.7 billion, with Meta alone generating over $134 billion, YouTube ads around $31 billion, TikTok exceeding $20 billion, and LinkedIn at $16 billion. But raw reach isn’t the same as quality reach, top-of-funnel social ads convert at a modest average of around 0.6%, which is expected, since the objective at this stage is attention, not action. The real payoff shows up later in the funnel, which is why awareness metrics should be judged on reach, impressions, and traffic, not sales.
Platform choice matters more at this stage than almost any other decision you’ll make. Facebook remains the most-used platform among marketers worldwide at around 83% adoption, with Instagram close behind at 78%, and each platform rewards a different creative format, short vertical video on TikTok and Reels, search-style discovery on Pinterest, and authority-driven long-form posts on LinkedIn. Pinterest alone reached 631 million monthly active users in early 2026, up 11% year over year, and its referral traffic converts at roughly double the rate of other social platforms because users arrive already searching with purchase intent. That’s a useful reminder that “awareness” doesn’t mean the same thing on every platform, some audiences are browsing, and some are already shopping.
Stage 2: Engagement — Fan/Follower, Website Visitor, Content Reader
Once someone notices you, the next job is to earn their attention long enough to build familiarity. This is where social posts, website optimization, and blogging come in, moving someone from casual viewer to fan/follower, then to website visitor and content reader.
Content format matters enormously here. Short-form video is now the dominant engagement driver: videos under one minute average roughly a 50% engagement rate, compared to just 17% for content running over an hour. On the influencer side, nano-creators are punching above their weight, TikTok nano-influencers see an average engagement rate of about 10.3%, and Instagram’s influencer base is now 75.9% nano-influencers. Community building is also treated as core strategy rather than a nice-to-have: 90% of social media marketers say building an active online community is critical to a successful strategy. This is the stage where trust starts to form and trust is what makes conversion possible later.
Blogging and on-site content, the “website optimization” and “blogging” tactics called out in the funnel, still carry weight even though social gets most of the attention. A blog post or resource hub is what turns a passing social visitor into a content reader, and it’s also what search engines index, so this stage does double duty: it nurtures the person who’s already engaged and it quietly feeds the Awareness stage through organic search months later. Brands that skip this step tend to have followers but no owned destination to send them to, which caps how far engagement can convert into anything measurable.
Stage 3: Conversion — Lead, Prospect, Customer
This is where the funnel gets serious: lead magnets and landing pages turn a content reader into a lead, a sales offer turns a lead into a prospect, and closing the deal turns a prospect into a customer.
The data here is sobering, and useful for setting realistic expectations. Organic social posts convert visitors at roughly 0.8% on average, paid social ads average around 1.5–2.1% for B2C, and bottom-of-funnel, decision-stage social ads reach about 3.2%. Referral traffic driven heavily by social sharing, word of mouth, and affiliate or influencer programs, significantly outperforms other channels, converting at 10.99–12.8%, more than three times the rate of average inbound traffic. Retargeting is another major lever: retargeting site visitors on social media can lift conversions by around 70%, and fast follow-up matters too, responding to a lead within 60 minutes can lift conversion rates by about 15%. Speed and warmth, not just volume, are what move people through this stage.
It’s also worth noting where social sits relative to other channels: across a broad cross-industry benchmark, the average conversion rate is around 6.6%, with email still the strongest single channel at roughly 19%. Social is often the lowest-converting channel in direct-attribution data, but that’s largely a measurement artifact. Social frequently plants the seed of intent that converts later through another channel like email or direct search, which is why multi-touch attribution matters so much for judging real social ROI.
B2B and B2C funnels also diverge sharply at this stage. B2C paid social campaigns convert at around 2.1% on average, more than double the roughly 0.9% seen in standard B2B campaigns, though AI-powered audience segmentation on platforms like LinkedIn has been narrowing that gap, lifting B2B conversion rates as high as 1.4% when applied well. The takeaway for B2B marketers: the lead magnet and landing page combination shown in the funnel matters even more when your natural conversion rate starts lower, since every bit of friction removed has an outsized effect.
Stage 4: Loyalty — Repeat Customer
Winning the sale isn’t the finish line; it’s the start of the most profitable part of the relationship. Customer service, FAQs, forums, and proactive email support are what turn a one-time customer into a repeat customer and the economics here are the strongest in the entire funnel.
Retaining an existing customer costs roughly 5 to 7 times less than acquiring a new one, and existing customers convert on future purchases at a 60–70% rate, compared to just 5–20% for a brand-new prospect. The payoff compounds too: increasing customer retention by just 5% can lift profits by 25–95%, and about 65% of a company’s total revenue typically comes from repeat customers. Loyalty also solidifies with each purchase, the probability that a customer buys again climbs to around 62% after their third purchase, which is why so many brands lean on loyalty programs; roughly 80% of Americans belong to at least one, and enrollment alone can boost repeat purchase rates by around 60%.
Stage 5: Advocacy — Brand Advocate
At the top of customer value sits the brand advocate, someone who creates fan content, shares user-generated content (UGC), and drives viral reach on your behalf, for free. This stage is less about paid tactics and more about giving happy customers a reason and a platform to talk.
This is also where trust compounds the most efficiently: authentic reviews and UGC are consistently identified as the most powerful form of social proof, directly shaping purchase decisions for other prospective customers. Brands that formalize this, through referral incentives, employee advocacy programs, or simply amplifying customer content, see measurable payoff; employee advocacy alone has been shown to increase organic reach by around 28%. Advocacy effectively resets the funnel, feeding new viewers back into the Awareness stage at almost no acquisition cost.
Where AI Fits Into the Funnel
It’s no longer possible to talk about a social media funnel in 2026 without talking about AI, because it now touches nearly every stage described above. Adoption is close to universal, 87% of marketers use generative AI in at least one workflow, and roughly 89.7% of social media teams use AI daily or several times a week. The impact is measurable rather than theoretical: AI content suggestions have been shown to lift social engagement by around 31%, and AI-assisted posting has produced engagement gains in the 32–35% range in independent studies, largely by helping teams personalize content and post at better-optimized times.
But the data also carries a genuine warning for the Awareness and Engagement stages specifically. Audiences are getting sharper at spotting AI-generated content, and it’s starting to cost brands trust rather than build it: roughly half of Gen Z users say they’ve unfollowed, muted, or blocked an account because they suspected the content was AI-generated, and a large majority of marketers who use AI-assisted content still apply moderate-to-extensive human editing before publishing. The practical lesson for the funnel: use AI aggressively for research, drafting speed, and personalization at the Conversion and Loyalty stages, where efficiency and relevance matter most, but keep a visible human hand on anything meant to build the trust that drives Engagement and Advocacy.
Turning the Funnel Into a Plan: Listen, Plan, Strategy, Tools
Understanding the funnel is half the job, operationalizing it is the other half. A simple four-step planning framework keeps strategy grounded in real customer data rather than guesswork:
1. Listen — Define who you’re actually talking to. Document customer age, gender, location, profession, income, and preferred platforms, and get precise about what makes your offer unique: product, service, or selling point.
2. Plan — Translate business objectives (revenue growth, cost reduction, public exposure) into strategic objectives (brand awareness, sales leads, customer relationships), and define what “achieving them online” actually looks like, comments, leads, or direct sales from social.
3. Strategy — Decide how social media will actually execute: which content types speak to which social channels, what resources each effort requires, and how you’ll evaluate results — tracking concrete outcomes like email subscriptions, qualified leads, website traffic, and content downloads.
4. Tools — Match content format (short messages, blog posts, photos, video, audio, word-of-mouth) to platform (Facebook, Twitter/X, LinkedIn, Pinterest, podcasts, blogs), since format-platform fit is often the biggest lever on engagement.
The Bottom Line
Social media marketing works best when it’s treated as an actual funnel rather than a content calendar. Awareness tactics fill the top; engagement content builds trust in the middle; conversion tactics close the sale; and loyalty and advocacy — the two most cost-efficient stages, turn customers into a self-sustaining growth channel. With global social media usage still expanding by roughly 294 million new identities a year, the brands that map their content deliberately to each funnel stage, rather than posting on instinct, are the ones capturing a disproportionate share of that growth.
References
1. DataReportal — Digital 2026 Global Overview Report: https://datareportal.com/reports/digital-2026-global-overview-report
2. DataReportal — Global Social Media Statistics: https://datareportal.com/social-media-users
3. SQ Magazine — Social Media Statistics 2026: https://sqmagazine.co.uk/social-media-statistics/
4. Amra & Elma — Top Marketing Funnel Conversion Statistics 2026: https://www.amraandelma.com/marketing-funnel-conversion-statistics/
5. Amra & Elma — Social Media Conversion Rate Statistics 2026: https://www.amraandelma.com/best-social-media-conversion-rate-statistics/
6. ZipDo — Social Media Conversion Rate Statistics: https://zipdo.co/social-media-conversion-rate-statistics/
7. DesignRush — CRO Statistics for 2026: https://www.designrush.com/agency/conversion-optimization/trends/cro-statistics
8. WifiTalents — Social Media Conversion Rate Statistics: https://wifitalents.com/social-media-conversion-rate-statistics/
9. Ruler Analytics — Conversion Rate Benchmarks 2026: https://www.ruleranalytics.com/blog/insight/conversion-rate-by-industry/
10. Web Tonic — E-commerce Social Media Marketing Stats 2026: https://www.webtonic.io/blog/e-commerce-social-media-marketing-statistics
11. HubSpot — Marketing Statistics: https://www.hubspot.com/marketing-statistics
12. Zippia — Customer Retention Statistics 2026: https://www.zippia.com/advice/customer-retention-statistics/
13. Invesp — Customer Acquisition Vs. Retention Costs: https://www.invespcro.com/blog/customer-acquisition-retention/
14. Yotpo — Customer Acquisition Vs. Retention: https://www.yotpo.com/blog/cost-of-customer-acquisition-vs-retention/
15. Flowlu — Customer Retention Statistics That Show Where Revenue Is Lost: https://www.flowlu.com/blog/crm/customer-retention-statistics/
16. The Stacc — AI Social Media Marketing Statistics 2026: https://thestacc.com/blog/ai-social-media-statistics/
17. AI Business Weekly — AI in Social Media Statistics 2026: https://aibusinessweekly.net/p/ai-social-media-statistics
18. Digital Applied — AI Marketing Statistics 2026: https://www.digitalapplied.com/blog/ai-marketing-statistics-2026-adoption-data-points
19. Axis Intelligence — Social Media Statistics 2026 / Users Worldwide: https://axis-intelligence.com/social-media-users-worldwide/

Joel Madtha is a strategic business leader, growth marketing expert, and transformation consultant with 20+ years of experience helping businesses scale with precision. Through joelmadtha.com, he shares insights on leadership, business growth, M&A strategy, and operational excellence. He is also the author of Determined Not Determined, focused on resilience, execution, and sustainable success.